When used in the browser, Herbie generates HTML reports full of information about the accuracy and relative speed of the initial and alternative expressions.
The top of the report page has a right-hand menu bar with additional links. “Metrics” give you detailed internal information about Herbie, while “Report”, if present, takes you back to the full Herbie report.
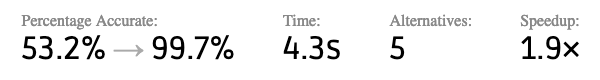
Below the menu lies a brief summary of the results. Herbie can produce multiple alternatives to the initial program, and this summary gives their basic statistics.
Next, the specification that you gave to Herbie. This section is closed by default. Typically, the specification is also the initial program, but in some cases, like if the :spec property is used, they can differ. The specification also includes any preconditions given to Herbie.
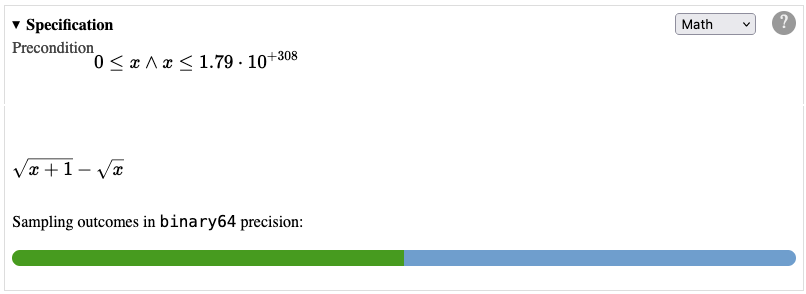
You can use the drop-down in the top left to display the specification in an alternative syntax.
Next, the Local Percentage Accuracy graph compares the accuracy of the initial program to Herbie's most accurate alternative. This is helpful for understanding the sorts of inputs Herbie is improving accuracy on. Sometimes, Herbie improved accuracy on some inputs at the cost of accuracy on other inputs that you care more about. You can add a precondition to restrict Herbie to the more important inputs in that case.
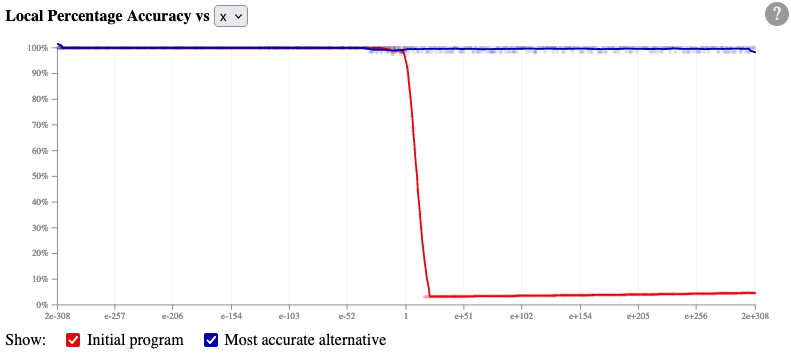
In the plot, each individual sampled point is shown with a faint circle, and the thick line is moving average of those individual samples. The red line is the initial program and the blue line is Herbie's most accurate alternative.
Accuracy is shown on the vertical axis, and higher is better. The horizontal axis shows one of the variables in the input program; the dropdown in the title switches between input variables. The checkboxes below the graph toggle the red and blue lines on and off.
If Herbie decided to insert an if statement into the
program, the locations of those if statements will be
marked with vertical bars.
Next, a Pareto graph and table list the alternatives Herbie found.
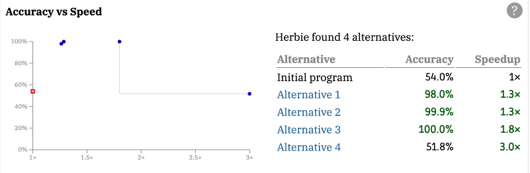
Both the plot and the table show the same data. In the plot, accuracy is on the vertical axis and speedup is on the horizontal axis. Up and to the right is better. The initial program is shown with a red square, while each of Herbie's alternatives is shown with a blue circle. A faint line shows the Pareto frontier—that is, it goes through all Herbie alternatives that maximize speed for their level of accuracy. Some of Herbie's alternatives may not be on the Pareto frontier due to differences between the training and test set.
In the table, each alternative is shown along with its accuracy and speed relative to the initial program. Values are green if they are better than the initial program, and black otherwise. Each alternative is linked to its description lower on the page.
Below the table come a series of boxes detailing the initial program and each of Herbie's alternatives, along with their accuracy and relative speed.
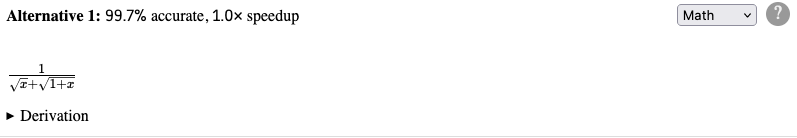
The accuracy and relative speed of each alternative is given in the title. Below the title, the alternative expression itself is given. The dropdown in the top right can be used to change the syntax used. If Herbie could not come up with anything better than the initial program, no alternatives are displayed.
Each alternative also has a derivation, which can be shown by clicking on "Derivation". The derivation shows each step Herbie took to transform the initial program into this alternative. The initial program has no derivation.
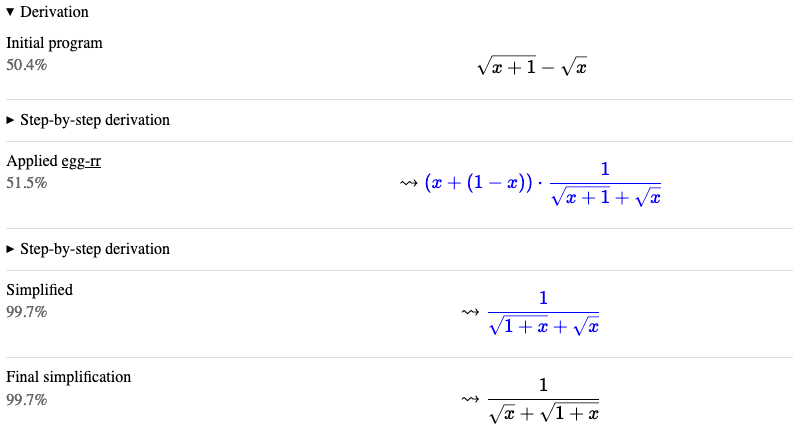
Each step in the derivation gives the accuracy after that step. Sometimes you can use that to pick a less-complex and not-substantially-less-accurate program. The derivation will also call out any case splits. When a part of the step is colored blue, that identifies the changed part of the expression.
Derivations may also contain "step-by-step derivations"; you can click on those step-by-step derivations to expand them. Each step in the step-by-step derivation names an arithmetic law from Herbie's database, with metadata-eval meaning that Herbie used direct computation in a particular step.
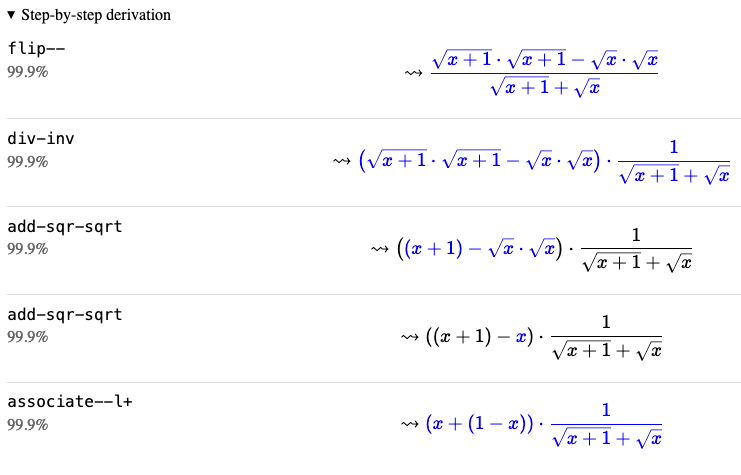
Derivations are intended to give you more confidence in Herbie's results and are not guaranteed to be an accurate reflection of Herbie's internal process of constructing an alternative.
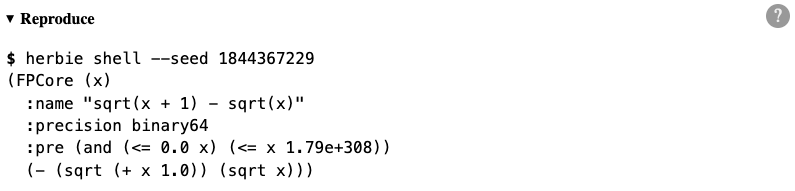
Finally, Herbie gives a command you can run to reproduce its result. If you find a Herbie bug, include this code snippet when filing an issue.
We expect the report to grow more informative with future versions. Please get in touch if there is more information you'd like to see.